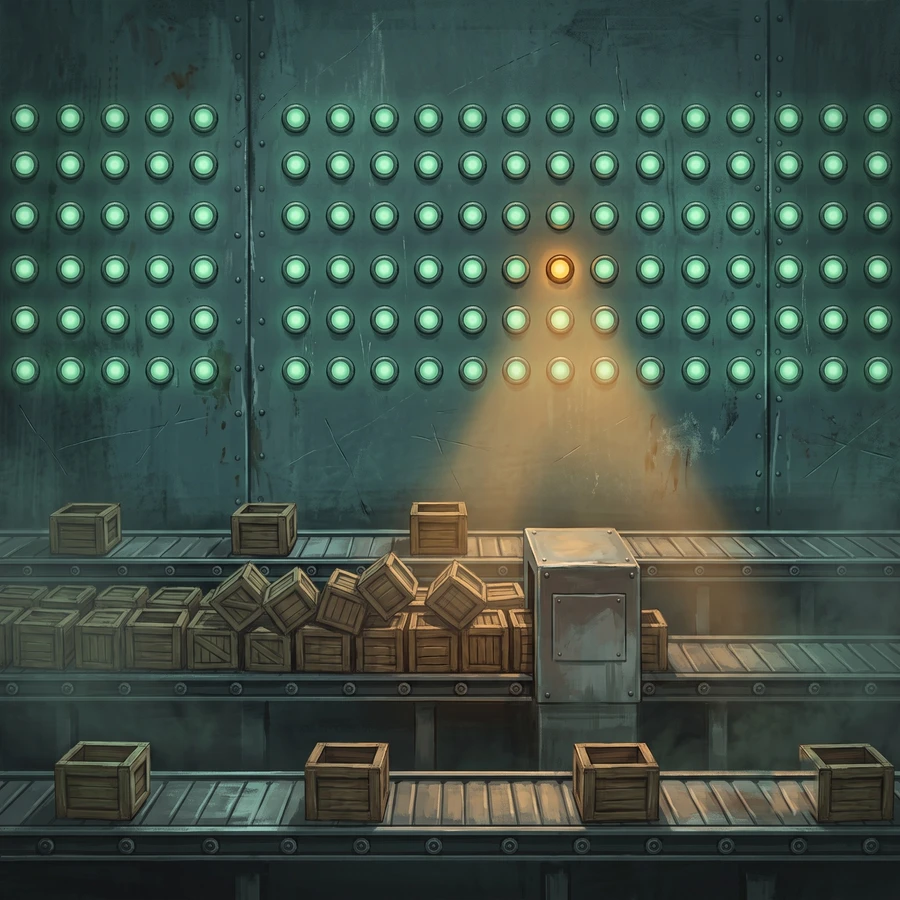
Picture a busy kitchen. Every order is split among the cooks, and the dishes are dealt out in strict turn, so each cook gets an equal share. Now let one cook be slightly slow. Every big enough order has a dish waiting on that cook, so every table eats late. Tables stay occupied longer, and the queue at the door grows with them. Nothing in this kitchen has failed. It is just slower, and slower is a failure mode.
We operated that kitchen at scale. Risk calculation jobs arrived in their thousands, each split into tens of thousands of tasks, dealt out in strict turn through a cluster of messaging nodes to a large pool of workers. While every node kept pace, the strict turn was exactly right, because it kept the load fair. The platform also carried a fair usage policy, mechanisms guaranteeing every piece of work got its fair share of compute and system time. Valuations for a small desk never queued behind those of a big desk simply because that desk got in first. The trouble was the odd node whose performance drifted, in one case because it sat on an oversubscribed cluster of virtual machines. It did not have to drift by much. Under heavy load, a node that keeps receiving its equal share of work but serves it slightly more slowly than the rest falls further behind with every round. Its queue builds quietly, task after task, and because every big enough job had tasks waiting on that node, the whole batch slowed with it.
We did have visibility, and we had plenty of it. A burndown chart showed the overnight batch, the full set of jobs due to run and how the run was progressing, sliced by job type. Every job in the system was visible too, how far it had progressed, which tasks it had in flight, and which jobs were still pending. Host metrics, queue depths and alerts on both covered the machines. None of it caught the drift. A queue deeper than its threshold fired an alert. A queue growing slightly faster than its peers did not. Overnight, the drift showed up as a batch running late, discovered only after we had lost valuable processing time while machines with capacity to spare waited for their next equal share.
The fix came in two parts. The grid kept dealing in strict turn, and the nodes now checked periodically whether a peer was falling behind and pulled work from its queue. The depth alerts stayed, and each node’s queue was now also compared with the rest of the pack. When a node drifted from its peers, the platform component responsible turned amber, with a message naming the underlying issue and a short recipe for putting it right.
This was work stealing, and it is exactly how the JVM schedules virtual threads today. Each carrier thread pulls from its own local queue with no contention, and a carrier that runs dry does not go to sleep. It steals work from the far end of a busier peer’s queue, so no core sits idle while tasks wait somewhere else. Our grid did the same thing across machines rather than threads, and the kitchen version is a cook glancing at the other stations between dishes.
Dealt in strict turn
Strict turn, cooks step in
The loop cooks slowly too
The second article in this series ended on a question. What happens when the system degrades quietly, and how would we know? An agent loop rarely fails outright. The model still answers, the tools still return, and the queue still drains. Under the hood the model starts calling a tool twice where once used to do, or reading less before it proposes, or retrying its way around an error that should have been surfaced. Every case still completes, but completeness is not the same as correctness. A case closed without the tool call it should have made completes just as cleanly, but the quality of the result drifts. The whole system is simply slower and slightly worse, and no red light is flashing anywhere.
You cannot deduce the quality of an agent’s output simply by looking at it. A language model is trained to produce a fluent answer, and in most cases it produces one regardless of what was present in its context window. A thorough answer and a shallow one arrive equally well written. On the grid, a struggling node at least looked like a growing queue. In a loop, the answer reads well either way.
Is the loop efficient? Where do the tokens go? Which calls repeat, and what causes the slowdowns? Which steps need the strongest model, and which would a cheaper one do just as well? Try answering them for your own loop. If the only number within easy reach is the token bill, the chances are that the loop is missing important metrics.
Evals are not tests gave one answer, an eval on a nightly clock, watching the quality of what the agent writes. That catches a change in the output, which is not necessarily a reflection of a change in the flow. Distributed platforms have been watching the flow for decades.
Every hop had a witness
Giraffe, the financial risk management platform I spent ten years of my career on, was built from many web services behind a load balancer. Some of the very best people in the industry worked on it, and it taught me what it costs to answer one simple question. Where did the request go?
Traffic arrived through an F5, a load balancer owned by the network team, which routed it to the nodes behind each DNS name. Each of those nodes ran HAProxy as a reverse proxy, terminating the encrypted connections, applying further routing if needed, and logging every request which went through. Varnish, the cache standing in front of some of the services, logged whether an answer came from the cache or went through to the service behind it.
The messaging layer recorded when a task was submitted, how long it queued, when it was picked up, how long it took to process, whether processing failed and whether it was replayed. Every external system we talked to had transport statistics of its own, request counts, latency percentiles with the minima, maxima and averages, and failure rates, so one of them having a difficult day was visible on a dashboard at a glance. Telegraf collected machine metrics, so a process or a host under heavy load was visible in its own right. The JVMs published their heap and off-heap usage and their garbage collection statistics, together with whether the process was swapping and how much of its memory sat swapped out on disk. The services ran under systemd on top of a Java service wrapper, and both wrote logs too.
All of it landed centrally, in one of two places. The logs were either routed directly or forwarded to Splunk, where an investigation could tie the layers together and chart anything over time when needed. The metrics went to InfluxDB, visualised on Grafana dashboards.
The tying together relied on trace identifiers, stamps carried on a request so its path can be followed from one service into the next. We did not have them everywhere at first. An investigation would run into a hop the identifier did not cross, the gap itself became a finding, and the identifier was carried one layer further. In some cases we had to refactor the system to capture the statistics we wanted at a specific place. Observability grew that way, one investigation at a time, each leaving a new witness behind it.
The F5 taught a lesson of its own. We asked more than once, but the network team did not have the necessary logs, so if a request went missing between the outside world and our front door, the only evidence that would ever exist was ours. We made sure our edge recorded enough to prove exactly where the trail ended.
The same witnesses, around a loop
An agent system is a distributed system, so everything above has a counterpart, almost one for one. Start with the calls themselves. Every tool call is logged with the case identifier it belongs to, so there is something to read when a case needs explaining. That extends the audit trail from the third article downwards, from decisions into plumbing.
Then the aggregates. How often is each tool called, per case and per day? Are the parameters unique, or is the model circling, issuing the same call with the same arguments and hoping? When tools belong to the same flow, do their call counts rise and fall together?
Then the path. Did the model issue the call at all? Did the call reach the tool? If the tool returned an error, did the error make it back into the transcript, or did a retry swallow it? Did the call disappear somewhere on the network? Was the answer served from a cache when the case needed a fresh read? Each of those is a place where a case can quietly lose time or truth, and each is answerable with the same witnesses the platform had, a log at every hop, a timing for every stage, and a case identifier that crosses all of them. On a healthy case the whole trail is a few lines.
case B-1002  ·  trail

  09:00:04  small  → show_break          B-1002                 182 ms   1,204 tokens
  09:00:11  small  → find_similar_cases  counterparty NRD-041    96 ms     976 tokens
  09:00:19  large  → check_break         B-1002                  41 ms   6,412 tokens   escalate, TOLERANCE-2
  09:00:27  large  → escalate            B-1002                  38 ms   2,612 tokens   accepted
  09:00:27  session closed               4 calls · 27 s · 11,204 tokens
Every question above is answered by a line like these, or by the line that is missing. A case that shows five reads and no check, a call that never got a reply, a timing that doubled against last month’s, all of it sits in plain sight once the trail exists.
The lifecycle timings translate directly. When was the case picked up, how long did it wait, how long did each tool call take, how long did the model spend between calls, and was the case replayed after a failure.
The machine metrics have their analogue too. Token spend per case is a capacity number. Latency per model call is a load number. A model provider having a slow day is an oversubscribed cluster you cannot see into, and your own timings are the only place where you can realistically see that. It is the F5 boundary again. The provider will show you no logs, so your record of every call, its timing and its outcome is the only evidence you will ever hold, and holding it is what makes that conversation possible in the first place.
A loop does not need to run on a single model, and a mix is often both cheaper and better. Allium already runs each phase of its loop as a separate agent, in its own context, and each agent can pin its own model, so swapping a step’s model is a one-line change. Judging the swap needs metrics for every model call, tagged with the step of the loop that made it. With those metrics in place, a swap shows what it changed, in tokens, in timings, and, next to the nightly eval, in the quality of what comes out.
Fair usage carries over too. An agent platform serving several desks shares one pool of model capacity, and a burst of cases from a big desk will queue everyone else’s work behind it unless fairness is baked in.
The second article left the final decision with a person, and that arrangement only works if the person can see how the case reached them. Approve on the summary alone and you are trusting whatever the loop chose to show. An escalation should arrive with its trail attached, the calls made, the reads taken, and the check that ran, so the person can judge rather than just sign.
Amber, with a recipe
The last lesson from the messaging cluster is about what an alert should say. When a node drifted from the pack, the component responsible turned amber, not red, the message named the underlying issue, and it carried a short recipe for what to try. The support person did not start from scratch. I would argue an agent platform should behave in the same way. One tool’s error rate is climbing and the errors are all timeouts, so the tool’s backing service goes amber with the timeout counts attached. The nightly quality score dipped and the traces show one document store serving reads slowly, so that store goes amber before anyone opens an investigation. Each alert names the component, gives the cause as far as it is known, and offers the first thing to try.
AMBER  case-history store
  reads p95 at 1.8 s, pack p95 at 210 ms
  effect  history citations arriving slowly on every desk
  try     check the store for throttling or a hot partition, then scale the read capacity
With the trail and the aggregates in place, every case shows what it cost, how long it took, which calls did the work and which repeated. And once you can see what each part costs, you can ask whether it has to be that way. Sometimes the answer is a smaller model in the right step. How to build that observability layer around a loop is an article of its own, and it is coming.
No alert will fire on its own when the loop that runs your cases begins to decline. It will complete every case, a little slower and a little shallower over time, and every individual answer will look fine on its own. The way to surface this has not changed. Watch every hop, measure every model call, compare every worker against the pack and alert on the drift, carry one identifier through everything, and treat each investigation that hits a gap as the discovery of the next witness. Slower is a failure mode. Build the witnesses before you need the testimony.