

From October 2020 until July 2021, I had the chance to work on an exciting greenfield project in the investment sector. The goal was to develop a data-intensive webapp able to handle hundreds of UI changes per second along with the resolution of thousands of formulas, taking as inputs live market data and user entered values.
As this has been the most performance-critical software I have built so far, I thought it might be useful to share the approaches and tools that were adopted to tackle slow performance, involving both scripting and rendering.
The project stack includes:
-
Reagent
-
Re-frame
-
Re-graph
-
Ag-grid/Ag-charts
Identifying the bottlenecks
Runtime Performance Analyzer
Browser developer tools are great at spotting slowdowns and their cause. In particular, the runtime performance analyzer provides in-depth insights about your app performance while it is running. The final report shows a dissected view of the code, which is presented as a stack of functions in a timeline, therefore making clear which parts take longer to execute. To know more about this tool you can check out this tutorial, so you can learn how to make the most out of it.
To illustrate the usefulness of this tool let’s start by looking at the performance of a single task:
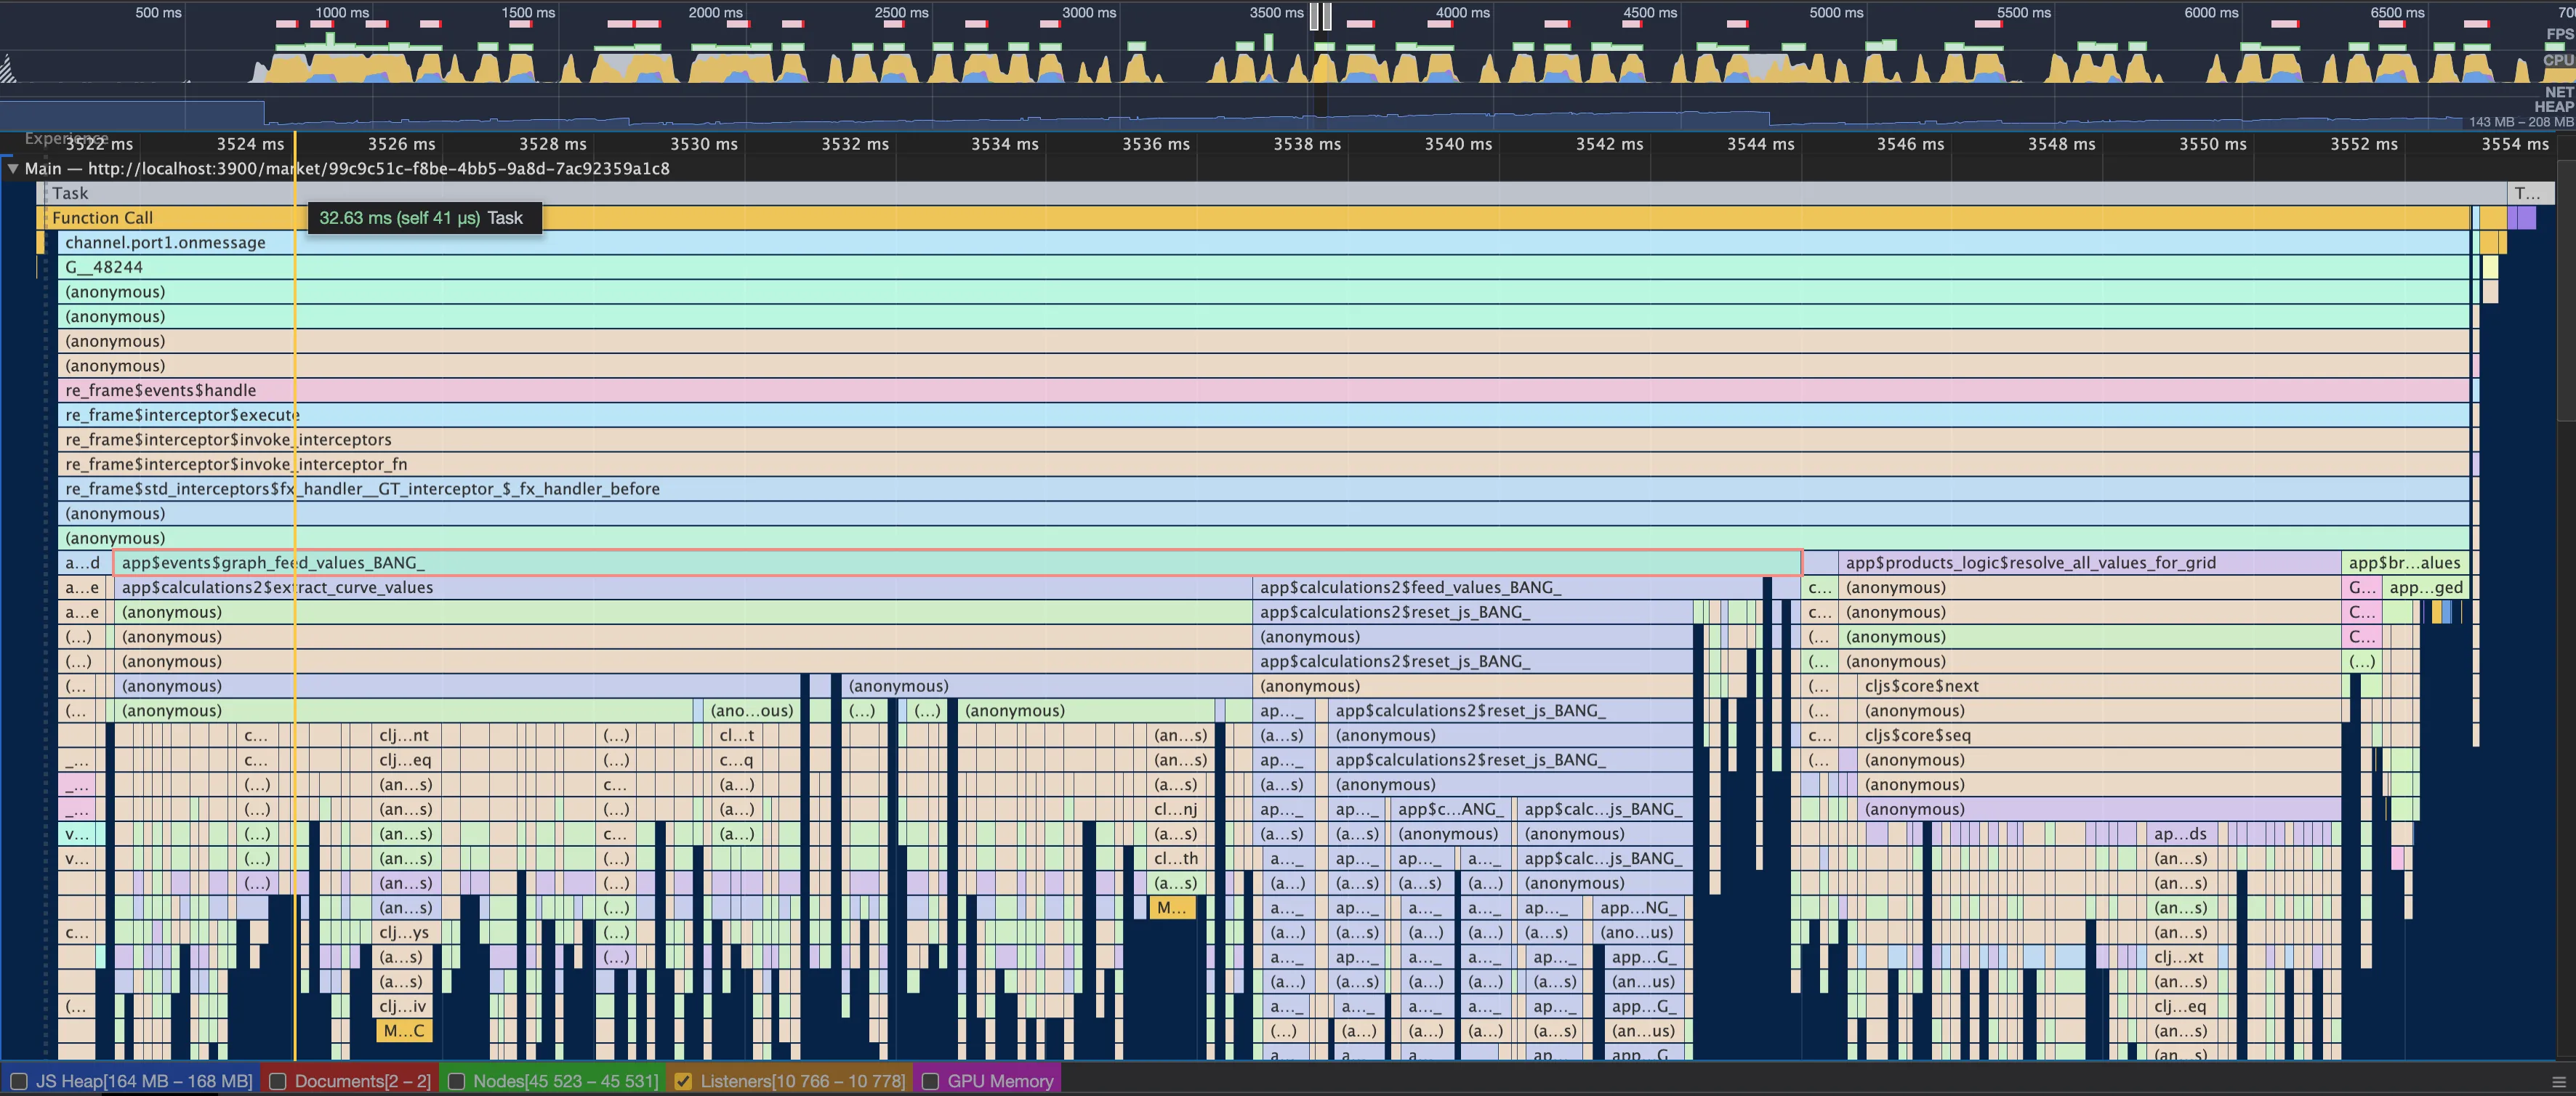
What you see above is a WebSocket message being received and processed.
From the top, channel.port1.onmessage is the function that is invoked
when the payload pings the client. Going down the stack, there are a
bunch of internal re-frame functions that finally lead to the app
business logic with the call to app$events$graph_feed_values_BANG_.
By hovering over the rectangle, you get the number of milliseconds the function in question took to execute. However, by clicking on it you can view a lot of extra information that helps better explore the code.
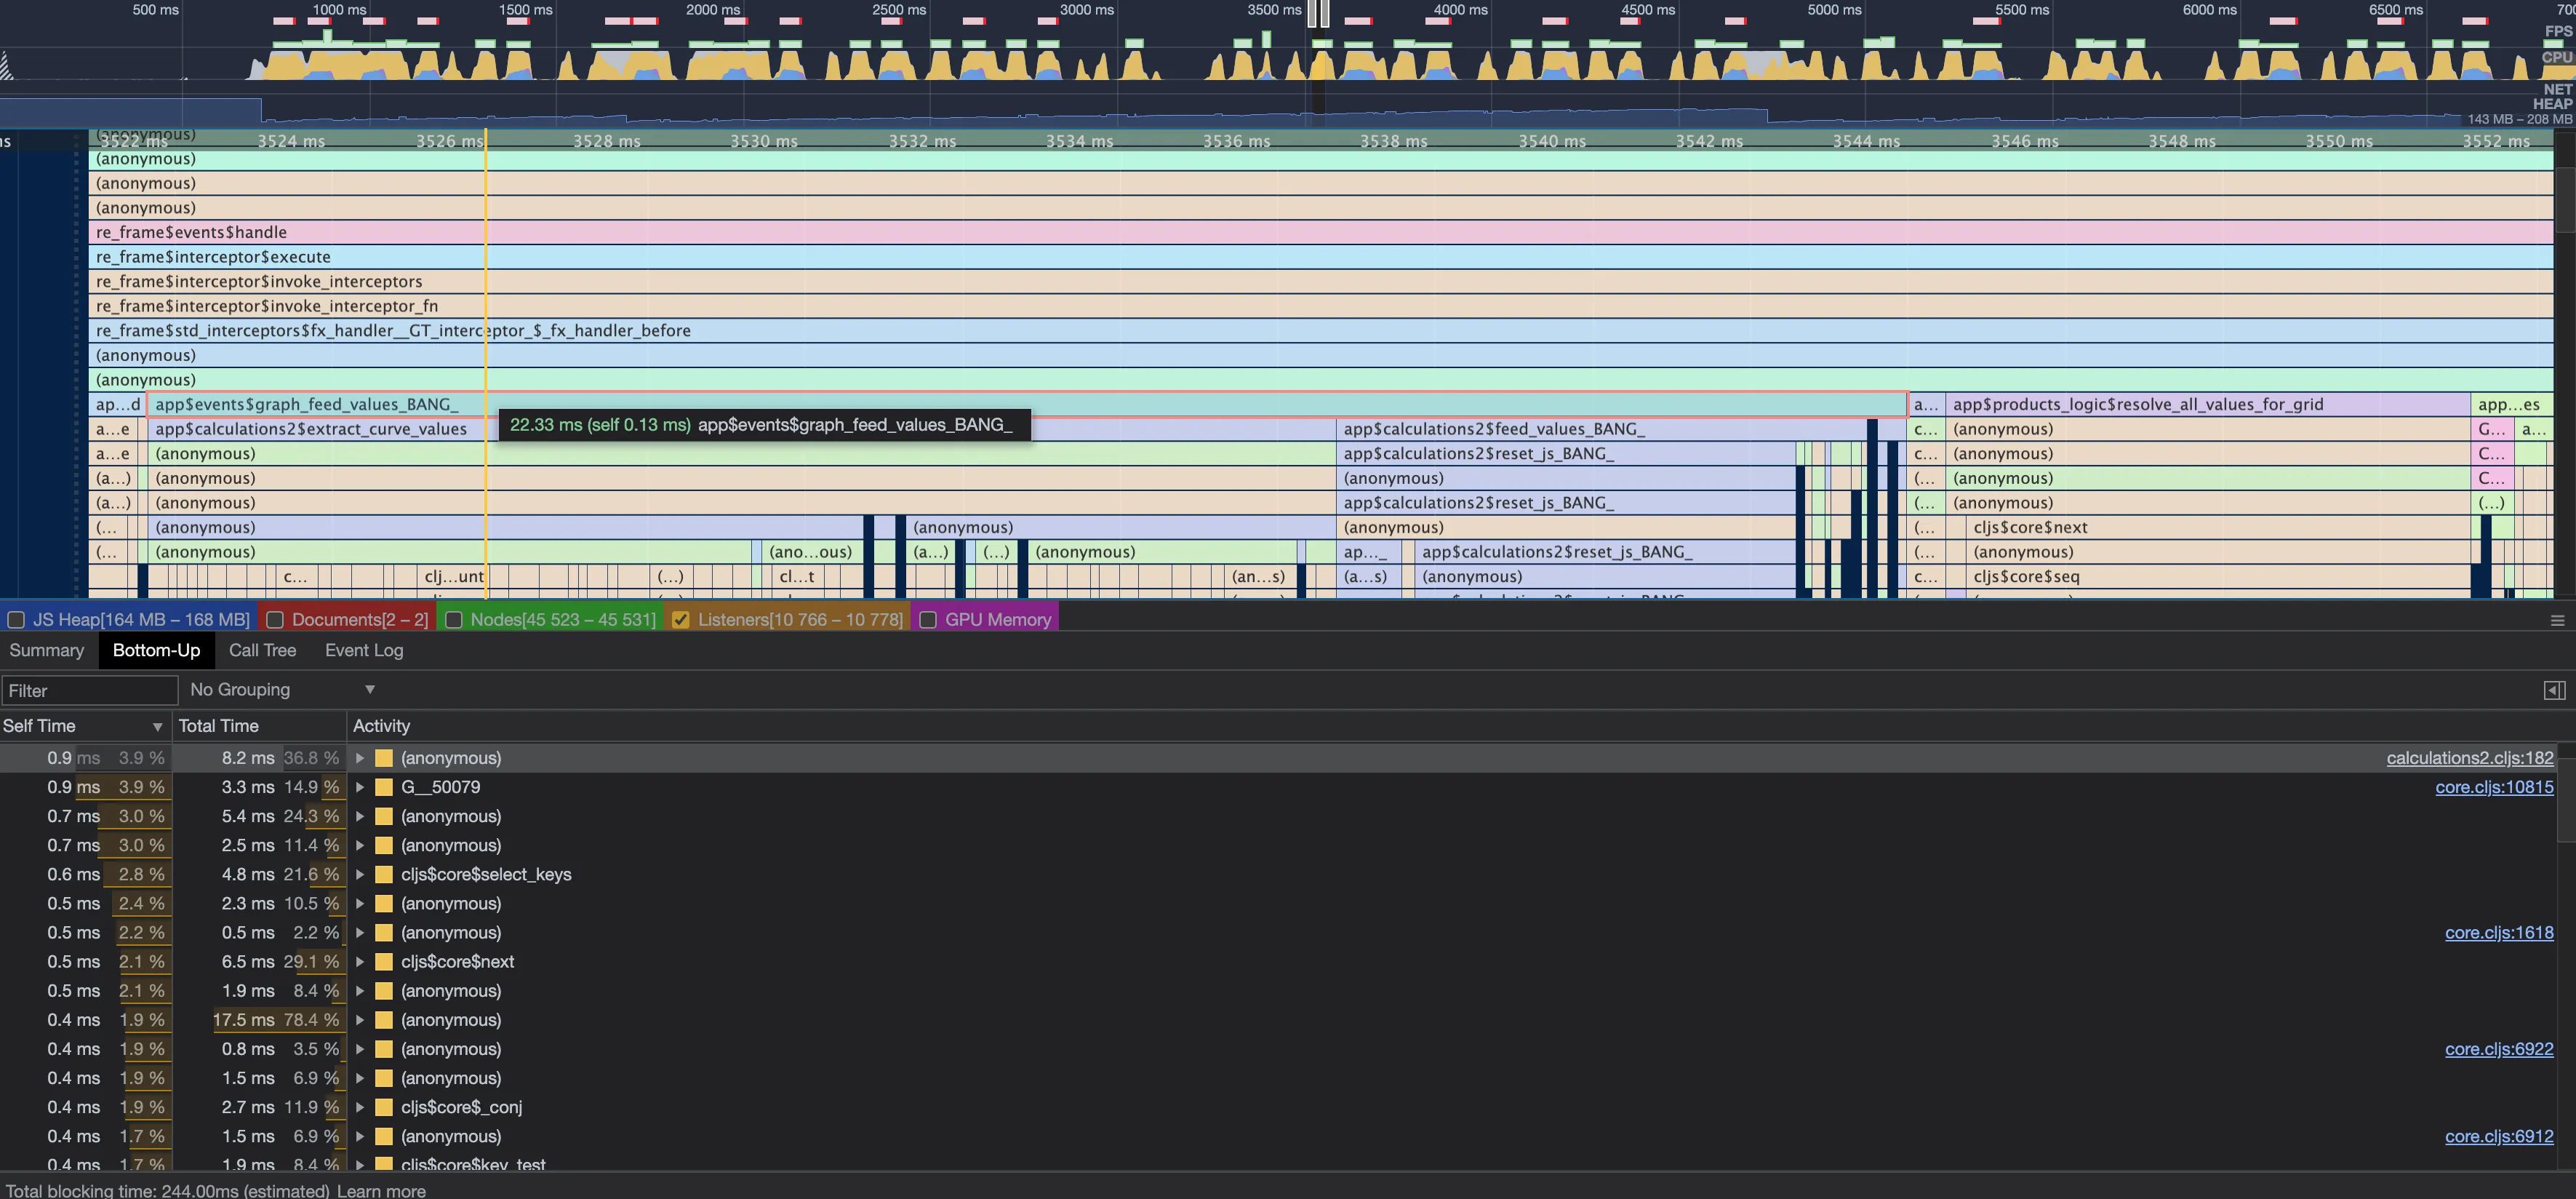
Focusing on the Bottom-Up pane, a list of activities can be sorted by
Self and Total time to immediately identify the slow running functions.
Additionally, by clicking on any of the file name links located at the
end of the rows, you can see the individual lines of source code that
are likely to downgrade performance.
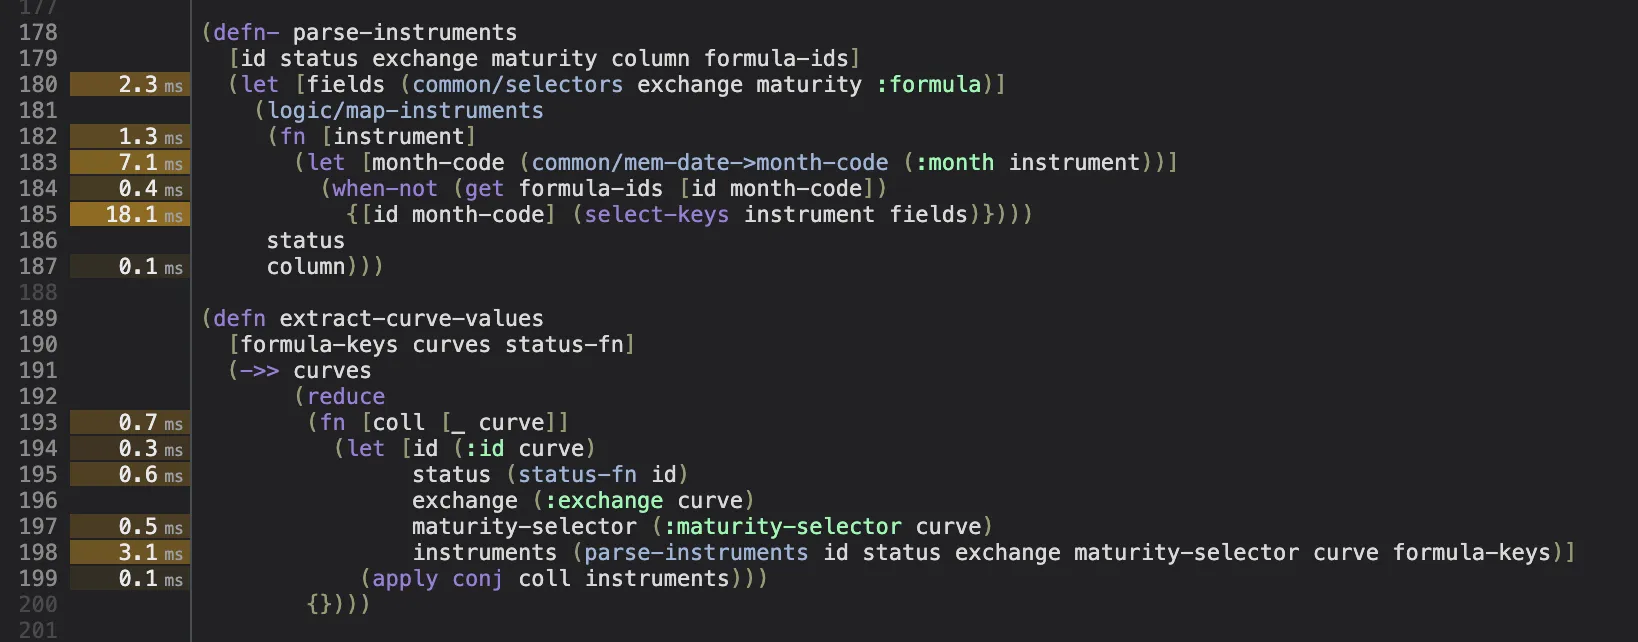
With only a 20 second investigation, we were able to spot that line
185 in the calculations2.cljs file might be taking too long to
complete, so we have a good starting point for making some improvements.
By right clicking over the area with the milliseconds it is also possible to add breakpoints, to pause the app execution for data inspection whenever the relevant line of code is invoked.
Performance Monitor
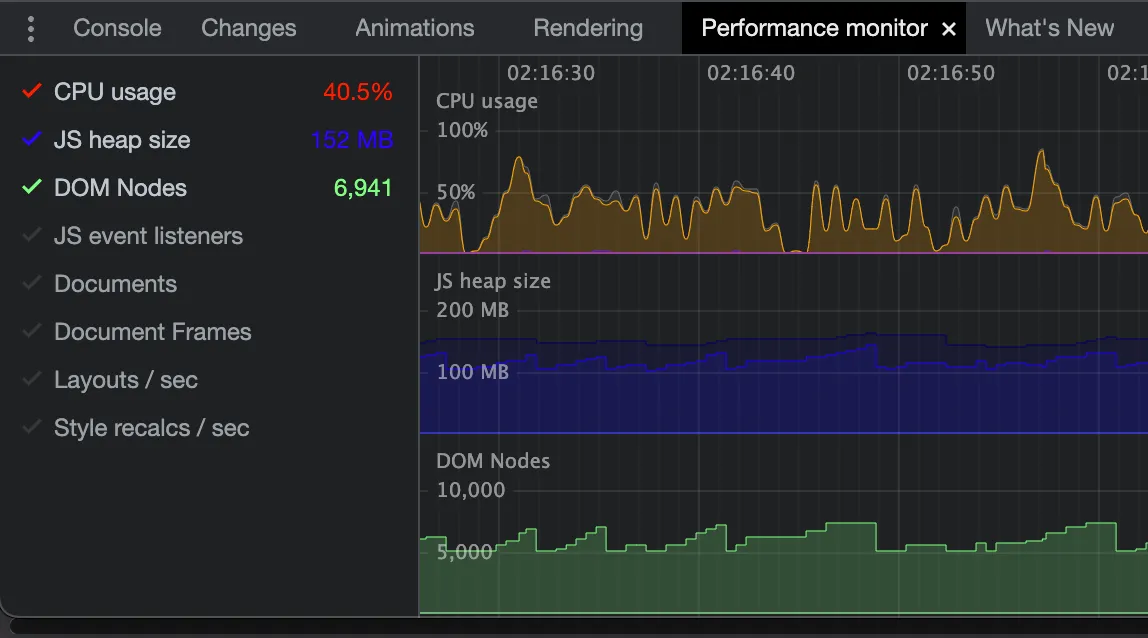
This tool runs while the user interacts with the app, and it tracks core metrics such as CPU usage, JS heap size, and so on. Although the performance monitor doesn’t tell us as much as the runtime performance analyzer, it still provides a great top level view of your app, indicating its overall health.
The performance monitor can be found by hitting ESC from the devtools.
If it’s not among the available tabs, it needs to be added from the left
three-dots menu. Here’s a picture of what it looks like:
Squeezing out performance
JS vs CLJS data structures
When possible, you should avoid going back and forth between JS and CLJS
data structures via the functions clj->js and js->clj. If you know
some data structure will be consumed by a JS component, consider
providing it in JS.
For example, AG Charts, a charting library, expects an array of objects
as one of the parameters i.e. [{value: 1}, {value: 2}]. Instead of
providing a CLJS vector and letting it be converted to JS, which implies
an extra recursive pass over the full collection, some interop can be
used to directly create a mutable JS array. The following example shows
how to generate a JS array from your CLJS code.
(reduce
 (fn [col value]
   (doto col (.push #js {:value value})))
 #js []
 (range 20))
Even though this code with interop is definitely less readable than normal Clojure, it can provide a nice performance boost in two specific cases:
-
The data structure is deeply nested
-
The generated output is fed to a component that updates very frequently
When processing props for components, Reagent doesn’t touch any JS data structure it encounters, in fact, it simply returns it, as can be seen from the source code.
To show the level of improvement that JS data structures can achieve let’s use the AG Charts example. A sample of the charting library props follows:
{:options
 {:data [{:value 1} ... ]
  :width 300
  :height 100
  :series
  [{:type "column"
    :xKey "type"
    :yKeys ["value"]}]
  :axes [{:type "category"}
         {:type "number"}]}}
To see how fast these props are converted into a JS object let’s have
one version with the :data being a CLJS vector and a second one with
it being a raw JS array. Also, let’s assume we have 500 data points we
would like to display in a chart.
With the following code, we can mock what reagent is doing under the hood with our props:
(def js-data
  (reduce
   (fn [col value]
     (doto col (.push #js {:value value})))
   #js []
   (range 500)))

(def cljs-data
  (reduce
   (fn [col value]
     (conj col {:value value}))
   []
   (range 500)))

(defn props-with-js-data
  []
  (clj->js
   {:options
    {:data js-data
     :width 300
     :height 100
     :series
     [{:type "column"
       :xKey "type"
       :yKeys ["value"]}]
     :axes [{:type "category"}
            {:type "number"}]}}))

(defn props-with-cljs-data
  []
  (clj->js
   {:options
    {:data cljs-data
     :width 300
     :height 100
     :series
     [{:type "column"
       :xKey "type"
       :yKeys ["value"]}]
     :axes [{:type "category"}
            {:type "number"}]}}))
Hence, we can now do some profiling directly from the CLJS REPL through the tufte library:
(ns ...
(:require [taoensso.tufte :as tufte :refer-macros (p profile)]))

(tufte/add-basic-println-handler! {})

(profile
 {}
 (dotimes [_ 1000]
   (p :js-data-props (props-with-js-data))
   (p :cljs-data-props (props-with-cljs-data))))
After evaluating the profile function, we get the following output in the console:
pId                  nCalls        Min      50% ≤      90% ≤      95% ≤      99% ≤        Max       Mean   MAD      Clock  Total

:cljs-data-props      1,000        0ns        1ms        2ms        2ms       13ms       19ms      951μs  ±73%      951ms    98%
:js-data-props        1,000        0ns        0ns        0ns        0ns        1ms        1ms       14μs ±197%       14ms     1%

Accounted                                                                                                           965ms    99%
Clock                                                                                                               973ms   100%
In this specific example, we can observe that the :js-data-props
logic was faster by almost 2 orders of magnitude: 951ms vs 14ms.
^Type Hinting
Type hinting the variables in the hot paths of your code is surely the simplest task you can perform, as it doesn’t require any code change. The compiler looks at the provided types and is able to produce more optimized code.
Types can be added via the metadata tag straight into the arguments vector or inlined when binding variables, as the following example shows:
(defn uppercase-name
  [^js params]
  (when-let [^string name (.-name params)]
    (clojure.string/upper-case name)))
If you are interested to know what happens under the hood, you can have a look at this article.
Anonymous vs Named Functions
Any anonymous function in your Reagent views is thrown away and re-defined at each state change. For this reason, it’s a good idea to use named functions in those components whose props or state are likely to update frequently.
You can test this behavior yourself with some simple code:
(def callbacks (atom #{}))
(def state (r/atom nil))

(defn view1 []
  (let [callback (fn [_] (reset! state (rand)))]
    (swap! callbacks conj callback)
    [:div
     [:p @state]
     [:p (count @callbacks)]
     [:button
      {:on-click callback}
      "Click me"]]))

(defn callback-fn [_] (reset! state (rand)))

(defn view2 []
  (let [callback callback-fn]
    (swap! callbacks conj callback)
    [:div
     [:p @state]
     [:p (count @callbacks)]
     [:button
      {:on-click callback}
      "Click me"]]))
When view1 is mounted, the callbacks count will grow along with the
button clicks. In contrast, view2 will only show a count of 1
regardless of the number of clicks on the button.
Dynamic Components
Loops in Reagent can have a massive performance impact if overlooked. Let’s start with an example:
(defn view1 []
  (r/with-let [state (r/atom nil)]
    [:div
     [:p "generating dynamic content"]
     [:div
      {:style {:display "flex"
               :flex-wrap "wrap"}}
      (let [deref-state @state]
        (for [x (range 100)]
          ^{:key x}
          [:div
           {:style {:padding "1em"
                    :border "1px solid black"}
            :on-click #(swap! state assoc x (rand))}
           (prn "in element:" x)
           [:p (str "element: " x)]
           [:p (str "value: " (get deref-state x))]]))]]))
In this view, we are creating 100 divs with their own on-click
handlers. Notice that we are also printing the string in element: x,
which gets logged in the console every time the state changes.
Upon clicking on any of the 100 elements, you will see the console printing 100 times because the hiccup vectors are fully recomputed over and over — very inefficient. Ideally, we want to only re-compute the components that need to be re-rendered. How can we achieve this? By moving the body of the for comprehension into its own functional component, as shown in the following example.
(defn component [state element value]
  [:div
   {:style {:padding "1em"
            :border "1px solid black"}
    :on-click #(swap! state assoc element (rand))}
   (prn "in element:" element)
   [:p (str "element: " element)]
   [:p (str "value: " value)]])

(defn view1 []
  (r/with-let [state (r/atom nil)]
    [:div
     [:p "generating dynamic content"]
     [:div
      {:style {:display "flex"
               :flex-wrap "wrap"}}
      (let [deref-state @state]
        (for [x (range 100)]
          ^{:key x}
          [component state x (get deref-state x)]))]]))
The key idea is to identify the parameters only relevant for the single
component. If we were to pass down the full deref-state, we would
still see the logs of all elements being printed.
The same concept can be applied to re-frame subscriptions. Avoid subscribing to big chunks of state from those components that are not directly affected by the data. This change alone can dramatically improve the responsiveness of your app.
Laziness
Laziness is an awesome asset when the realization of data structures is not needed upfront. However, if lazy functions are invoked from the wrong places i.e. in the middle of a recursion like in this example, they can lead to performance degradations and even completely fill the execution stack, thus throwing stack overflow exceptions.
Let’s write two different implementations that generate a vector of integers:
(profile
 {}
 (dotimes [_ 1000]
   (p :lazy-fn (->> (map vector (range 1000))
                    (reduce conj [])
                    (apply concat)
                    doall))
   (p :tansduce-fn (transduce
                    (comp (map vector) cat)
                    conj
                    (range 1000)))))
You can see in the following report how the use of transducers can produce the same output in about one third of the time it takes for the lazy function.
pId              nCalls        Min      50% ≤      90% ≤      95% ≤      99% ≤        Max       Mean   MAD      Clock  Total

:lazy-fn          1,000        0ns        0ns        1ms        1ms        1ms        2ms      458μs ±109%      458ms    72%
:tansduce-fn      1,000        0ns        0ns        1ms        1ms        1ms        1ms      179μs ±164%      179ms    28%

Accounted                                                                                                       637ms   100%
Clock                                                                                                           638ms   100%
Hidden Mutability
The CLJS core namespace provides great tools to squeeze out even more speed. In fact, through transient data structures mutability is “secretly” exploited while generating the final immutable result.
Input and output don’t change, yet the transient code is faster:
(profile
 {}
 (dotimes [_ 1000]
   (p :immutable (reduce #(assoc %1 %2 %2) [] (range 1000)))
   (p :transient (persistent! (reduce #(assoc! %1 %2 %2) (transient []) (range 1000))))))


pId            nCalls        Min      50% ≤      90% ≤      95% ≤      99% ≤        Max       Mean   MAD      Clock  Total

:immutable      1,000        0ns        0ns        1ms        1ms        1ms        1ms      101μs ±180%      101ms    71%
:transient      1,000        0ns        0ns        0ns        0ns        1ms        1ms       41μs ±192%       41ms    29%

Accounted                                                                                                     142ms   100%
Clock                                                                                                         142ms   100%
Memoize
Memoizing is a caching technique that saves processing time when some pure function is invoked with already seen parameters. Instead of running the logic, the function performs a lookup and yields the stored result.
This method is particularly useful when the function’s possible inputs are limited. This means that if a function takes an integer from 0 to n, the smaller the n the better. If n approaches a big number like 1000, we need to consider that there will be at worst a lookup map with 1000 entries for the memoized function. Therefore, it’s important to keep in mind that the lookup map might grow unbounded causing memory problems that are cleared only after a page refresh.
A good fit for memoizing would be a function that transforms say a month
code i.e. A20, B20, ... to the next one based on an integer.
(defn offset-month [code x]
;; expensive logic with lots of string manipulations
...)

(offset-month "A20" 3) ;; => "D20"
(offset-month "C20" 1) ;; => "D20"
(offset-month "N20" 1) ;; => "A21"
The above function was implemented in the investment project codebase, and it could be memoized for the following reasons:
-
the
codeparameter almost always refers to the current month -
The
xparameter is bound between 0 and 36
These two constraints alone are good enough to safely memoize this function, which is by the way invoked several hundred times a second. The usage would be the following:
(def mem-offset-month (memoize offset-month))

;; logic is run
(mem-offset-month "A20" 4) ;; => "E20"

;; logic is skipped, as "A20" and 4 are found in the cache state
(mem-offset-month "A20" 4) ;; => "E20"
It’s worth noting that the CLJS built-in memoize function never
invalidates the cache. However, there are libraries out there that can
give you more control over your memoizing strategy.
Hidden Tab
A document.hidden property can be watched to detect if the app tab is visible in the browser. This allows you to filter out any expensive logic that does not require execution when the app is hidden.
With the following re-frame handlers you can watch for tab visibility changes in your app:
(defn visibility-props
  "Get the name of the hidden property and the change event for visibility"
  []
  (cond
    (some? js/document.hidden) {:hidden "hidden"
                                :visibility-change "visibilitychange"}
    (some? js/document.msHidden) {:hidden "msHidden"
                                  :visibility-change "msvisibilitychange"}
    (some? js/document.webkitHidden) {:hidden "webkitHidden"
                                      :visibility-change "webkitvisibilitychange"}
    :else (js/console.error "visibility prop not found in visibility-props fn")))

(rf/reg-event-fx
 :handle-visibility-change
 (fn [{db :db} [_ hidden-prop-name]]
   (let [visible? (not (gobj/get js/document hidden-prop-name))]
     (prn "chrome tab visibility changed:" visible?)
     {:db (assoc db :chrome-tab-visibility visible?)
      :fx [(when visible? [:dispatch [:any-event-you-need-to-run]])]})))

;; to be invoked once on init when mounting your app
(rf/reg-event-fx
 :register-visibility-change
 (fn [{db :db} _]
   (let [{:keys [hidden visibility-change]} (visibility-props)]
     (js/document.addEventListener
      visibility-change
      #(rf/dispatch [:handle-visibility-change hidden]))
     {:db (assoc db :chrome-tab-visibility true)})))
Then, you can conditionally check for (:chrome-tab-visibility db) in
your handlers before running expensive logic.
Debounce/Throttle bulk updates
In the investment project, users are able to increase and decrease
values in an excel-like fashion through CTRL+UP/CTRL+DOWN shortcuts. A
common use case is to hold the shortcuts until the desired values are
reached. Clearly, this means that if the desired value is 22 and the
current one is 2, there would be 20 updates being sent to the server
within seconds.
It can be appreciated that the user is only interested in the last value, 22. Consequently, we can proceed to skip all the intermediate steps and simply send the final payload.
How can this be achieved? By debouncing the cell updates. In practice,
the app does nothing until n milliseconds have passed since the last
cell update. When this condition is met, the data is actually sent to
the server.
You can implement the debounce functionality in a re-frame effect with the following code.
(defonce debounce-timeouts (atom {}))

(rf/reg-fx
 :dispatch-debounce
 (fn [[id event-vec n]]
   (js/clearTimeout (@debounce-timeouts id))
   (swap! debounce-timeouts assoc id
          (js/setTimeout (fn []
                           (rf/dispatch event-vec)
                           (swap! debounce-timeouts dissoc id))
                         n))))
If you are interested in throttling, which runs your logic at n millisecond intervals as long as your throttled event is being fired, you might have a look at this snippet.
(defonce throttle-timeouts (atom {}))

(rf/reg-fx
 :dispatch-throttle
 (fn [[id event-vec n]]
   (when (not (get @throttle-timeouts id))
     (swap! throttle-timeouts assoc id
            (js/setTimeout (fn []
                             (rf/dispatch event-vec)
                             (swap! throttle-timeouts dissoc id))
                           n)))))
You can call these effects from your re-frame handlers, or directly wrap them with events so that they can be used from your views as well. An example of how to throttle an event would look like this:
(rf/reg-event-fx
 :my-event-throttled
 (fn [_ _]
   {:dispatch-throttle [:id-unique-to-event
                        [:my-event]
                        50]}))
Code Splitting
If your app takes too much time to load, you might be interested in splitting your bundle into smaller parts so that it can be served faster. This is a good article that walks you through the steps you need to take to serve your app more efficiently.
Going Further
With the techniques described above, we produced a webapp application with exceptional performance that compares highly favorably to competitors in the market. However, if requirements change and we need to push rendering performance even further, where do we go from here?
We mentioned that Reagent and Re-frame were the main libraries used in this project. Reagent components can be expensive to render frequently because hiccup uses Clojure vectors, which are immutable data structures that carry a relatively high garbage collection cost.
When dealing with frequently-rendered components, we can optimize the rendering process even further by eliminating these hiccup structures. This means creating React components without using Reagent, and instead either writing them in raw React through plain interop, using an alternative ClojureScript library like Helix, or importing components from tsx/jsx files. We think libraries like Helix could allow us to take ClojureScript + React web applications to the next performance frontier.